.png)
Engagement: ENPS
eNPS Page
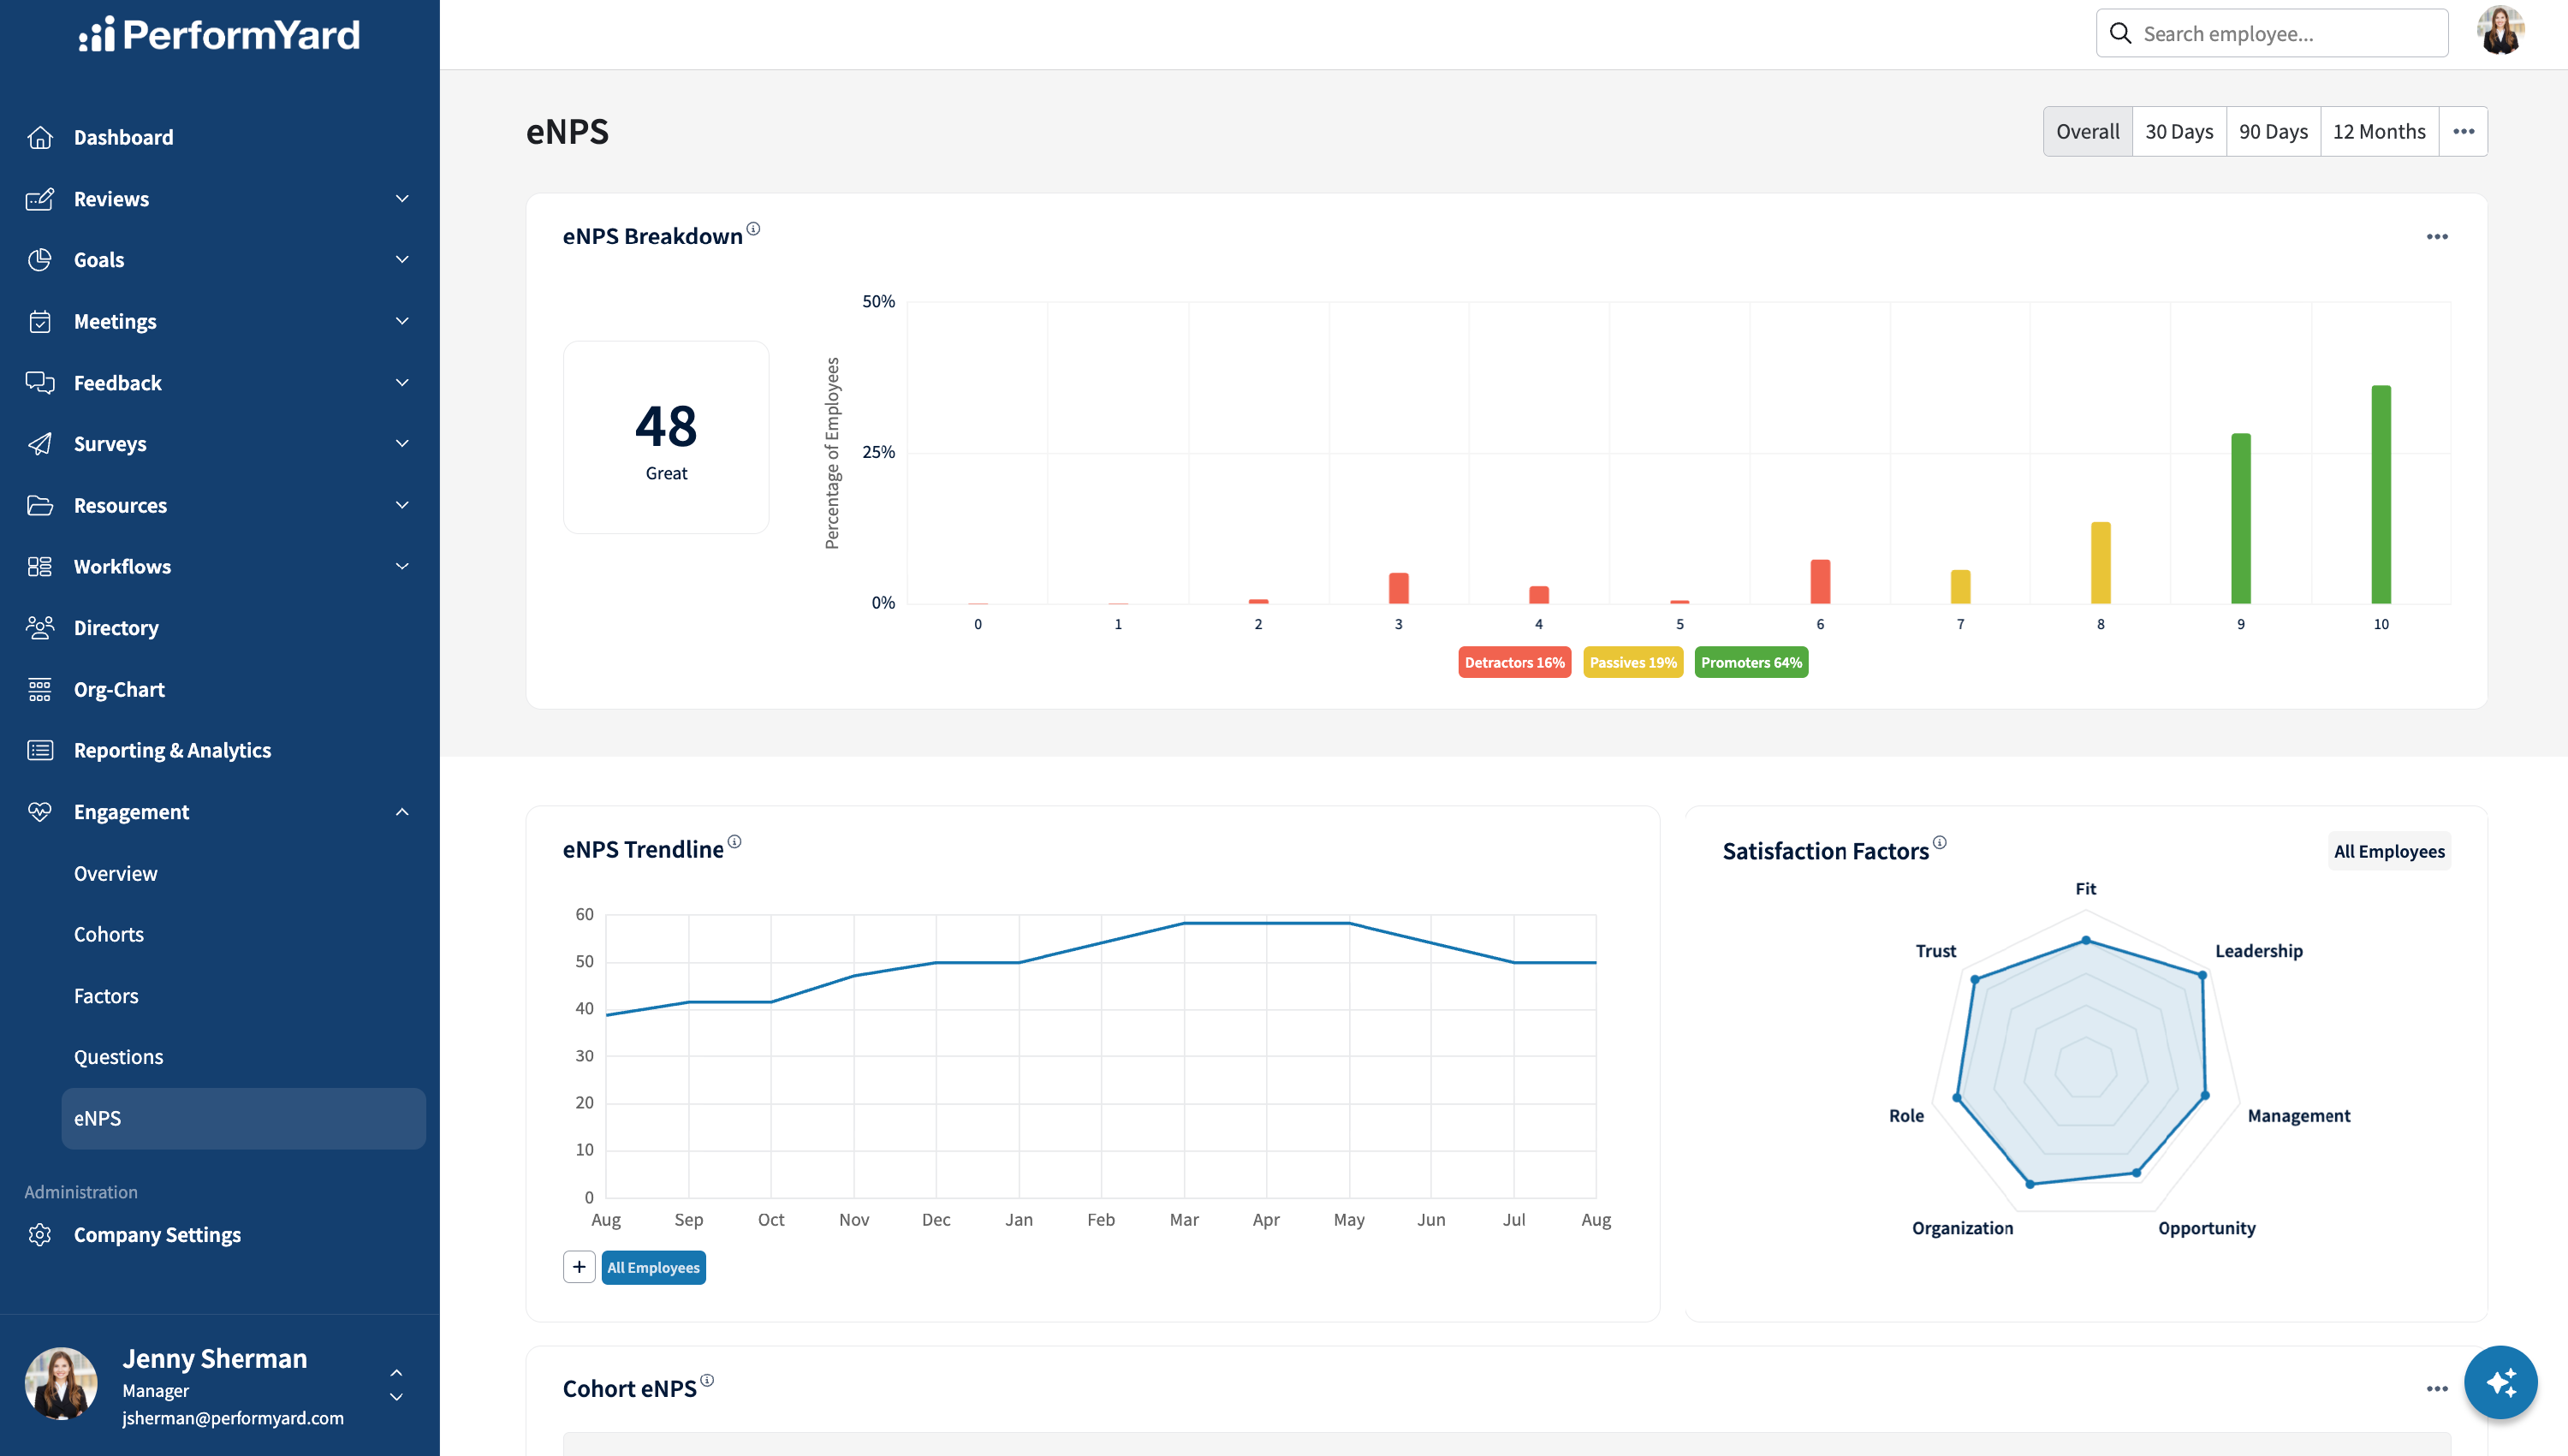
The eNPS page enables the analysis of employee engagement down to specific cohorts and the ability to look at trends for eNPS scores over time. An HR Administrator could, for example, visit this page to track if a recently instituted program has affected engagement ratings (as measured by eNPS) after being rolled out to employees or subsets of employees.
eNPS Breakdown
This visualization provides additional insights into the underlying ratings given by employees to the eNPS question on the employee engagement survey (shown below).

The eNPS breakdown chart provides an HR Administrator with a more detailed view into the relative "strength" of employees' opinions as they answered the question, for example, the number of detractor employees who gave a rating of 0 vs. those who gave a rating of 6. Presumably, those rating a 0 are more dissatisfied or more strongly disagree with the eNPS statement than those who gave a rating of 6.
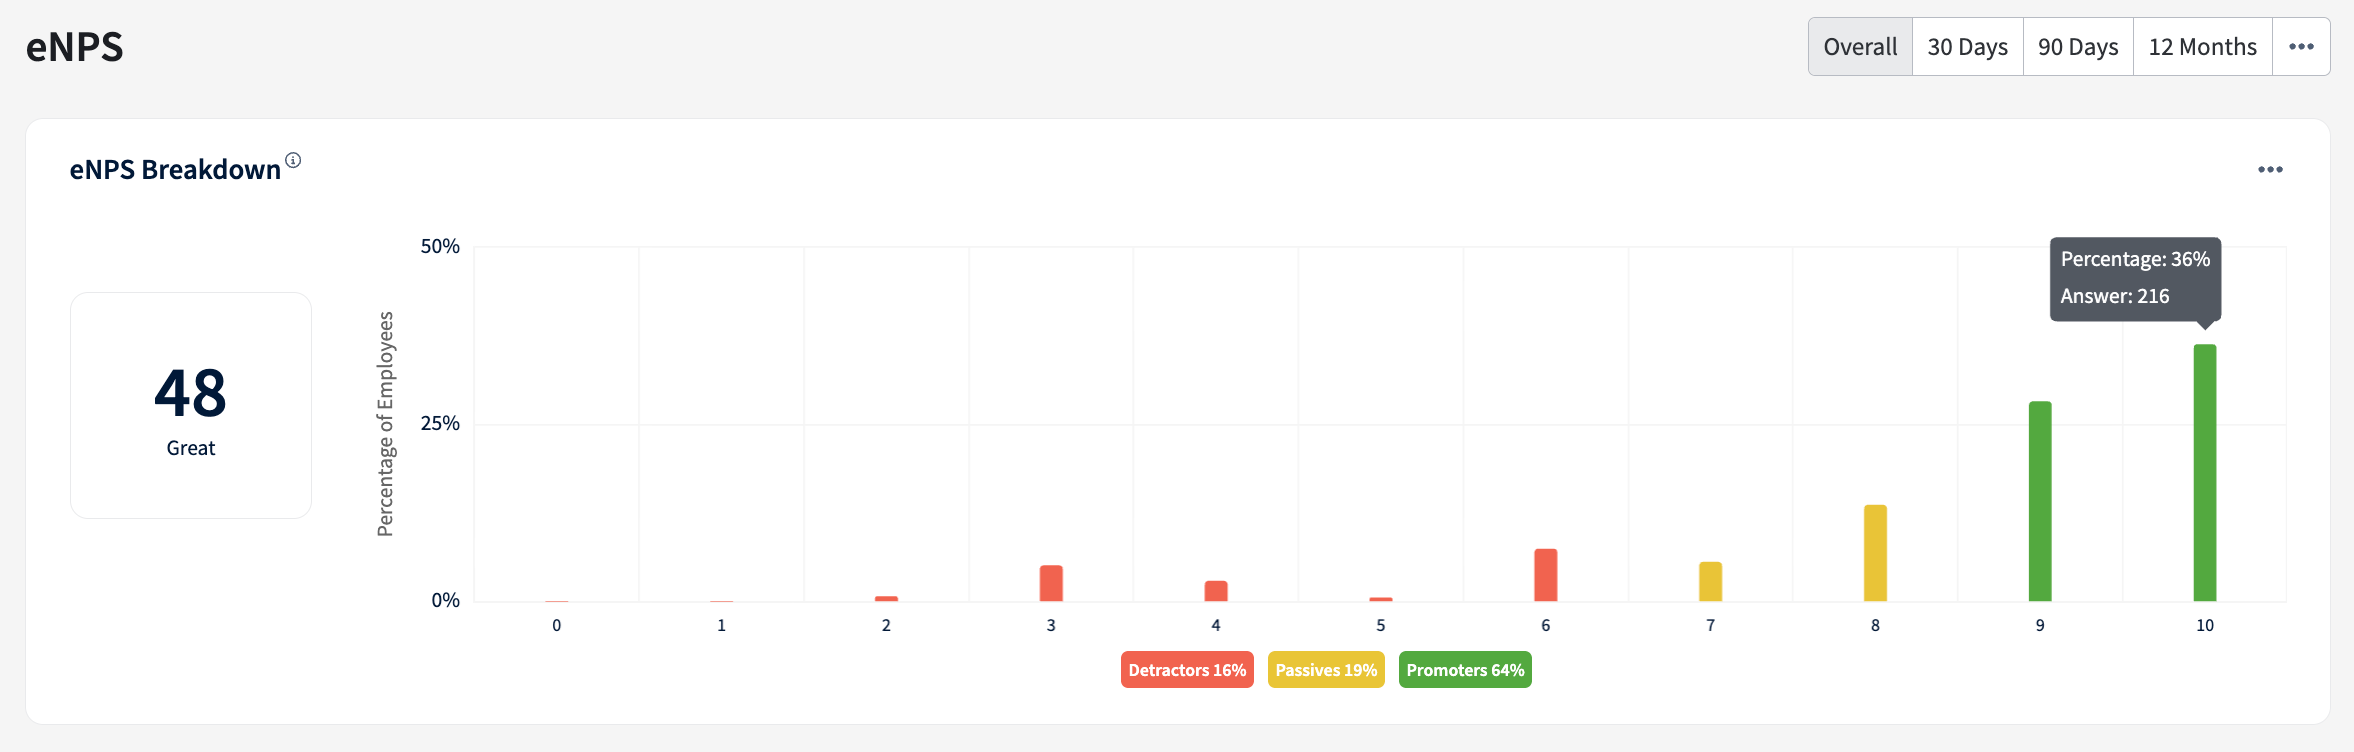
In addition to viewing your eNPS score breakdown, you can also download a list of additional feedback answers you have received if you have the Additional eNPS Feedback field enabled by using the Download CSV option located in the upper right of your eNPS Breakdown chart.
eNPS Trendline
The trend chart will display the historical eNPS scores across all employees and selected cohorts for the selected period. The chart compares the historical eNPS scores for up to 4 different cohorts and the overall employee satisfaction. Individual points on the trend chart are hoverable and will display a tooltip with the actual value at that point. Selecting a point from the trendline will update the satisfaction score radar chart to allow for a visual correlation between eNPS Scores and potential satisfaction factors that might explain the higher or lower eNPS Score.

Cohort eNPS
The table provides a per-cohort view of eNPS scores for the selected period and details of each cohort's distribution of detractors, passives, and promoters. In addition to the % of promoters, passives, and detractors, the chart will also display the average rating given by those employees. Like the eNPS Breakdown chart above, this may provide HR Administrators with additional insights into the "strength" of employees' opinions as they answer the eNPS question. For example, a lower average rating (closer to 0) among detractors would indicate more substantial dissatisfaction.

The Cohort eNPS table results can also be downloaded as a CSV File to allow further analysis or visualization in your preferred spreadsheet or BI tool.

The resulting CSV file will contain the following columns of information:

| Cohort | Text | Name of the Cohort |
| eNPS Score | Number | eNPS Score (-100 to 100) calculated as the % promoters minus % detractors. |
| Detractors % | Percentage | Percentage of Responses that were Detractor ratings (rating of 0..6) |
| Detractors # | Number | Number of responses that were detractors (rating of 0..6) |
| Detractors Average | Number | The average rating across detractor responses (0..6) |
| Passives % | Percentage | Percentage of responses that were passive ratings (rating of 7 or 8) |
| Passives # | Number | Number of responses that were passives (rating of 7 or 8) |
| Passives Average | Number | The average rating across passive responses (7..8) |
| Promoters % | Percentage | Percentage of Responses that were Promoters ratings (rating of 9 or 10) |
| Promoters # | Number | Number of responses that were passives (rating of 7 or 8) |
| Promoters Average | Number | The average rating across promoter responses (9..10) |
Overview of eNPS
eNPS provides a standard question to gauge the likelihood of an employee recommending the company to others for employment. eNPS provides another data point, alongside the satisfaction question and factors, to help gauge employees' satisfaction and engagement towards the company.
The eNPS Question
The standard eNPS question is, "How likely are you to recommend our company to a friend or colleague seeking new employment opportunities?"

The question is answered on a rating scale ranging from 0 for Strongly Disagree to 10 for Strongly Agree. The respondents' answers are then mapped into three categories of responses: promoters, passives, and detractors.
- a Promoter is an employee or respondent highly likely to recommend the company, reflected in a rating of 9 or 10.
- a Passive is an employee that may be ok with the company but is unlikely to go out of their way to recommend the company, reflected in a rating of 7 or 8.
- a Detractor is an employee likely to speak negatively about the company, reflected in a rating of 0..6.
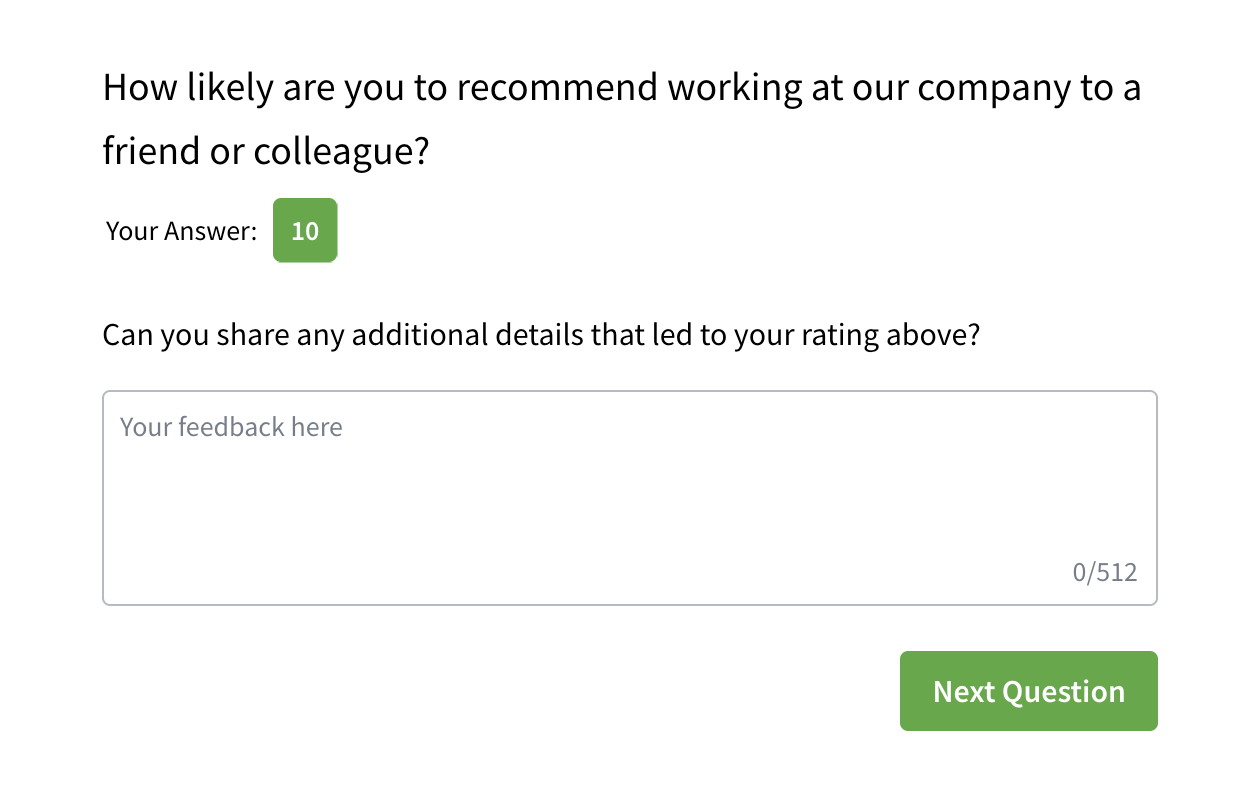
Depending on your organization's pulse survey settings, additional feedback may be requested of the respondent if their answer to the standard eNPS question falls within a specified range. The additional eNPS feedback question asks the respondent to share any details that led them to give the eNPS rating they selected.
The eNPS Score
The eNPS score is based on a standard question with a rating scale of 0..10, where individual answers are mapped to promoters, detractors, and passives. As described above, a promoter is an employee who responded to the eNPS question with a rating of 9 or 10, and a detractor is an employee who answered the question with a rating of 0..6. The eNPS score is calculated as the percentage of promoters minus the percentage of detractors.
eNPS Score = % Promoters - % Detractors
What is a good eNPS score?
While there is no settled industry standard for gauging a good eNPS score versus a great eNPS score, the application uses the following thresholds when visualizing the eNPS breakdown chart:
- Negative: Needs Improvement - there are more detractors than promoters;
- 0..30: Good - Promoters outnumber detractors; some room to continue to improve;
- 30..70: Great - Promoters significantly outnumber detractors. It might be interesting to drill down into specific cohorts for improvement opportunities for subsets of employees or specific engagement and satisfaction factors.
- 70+: Excellent