.png)
Engagement: Factors
Factors Page
The Factors page enables the analysis of employee satisfaction and engagement down to individual factors and the ability to see any trends or shifts in ratings over time for individual factors. An HR Administrator could, for example, visit this page to track if a recently instituted program has affected engagement or satisfaction ratings after being rolled out to employees or subsets of employees.
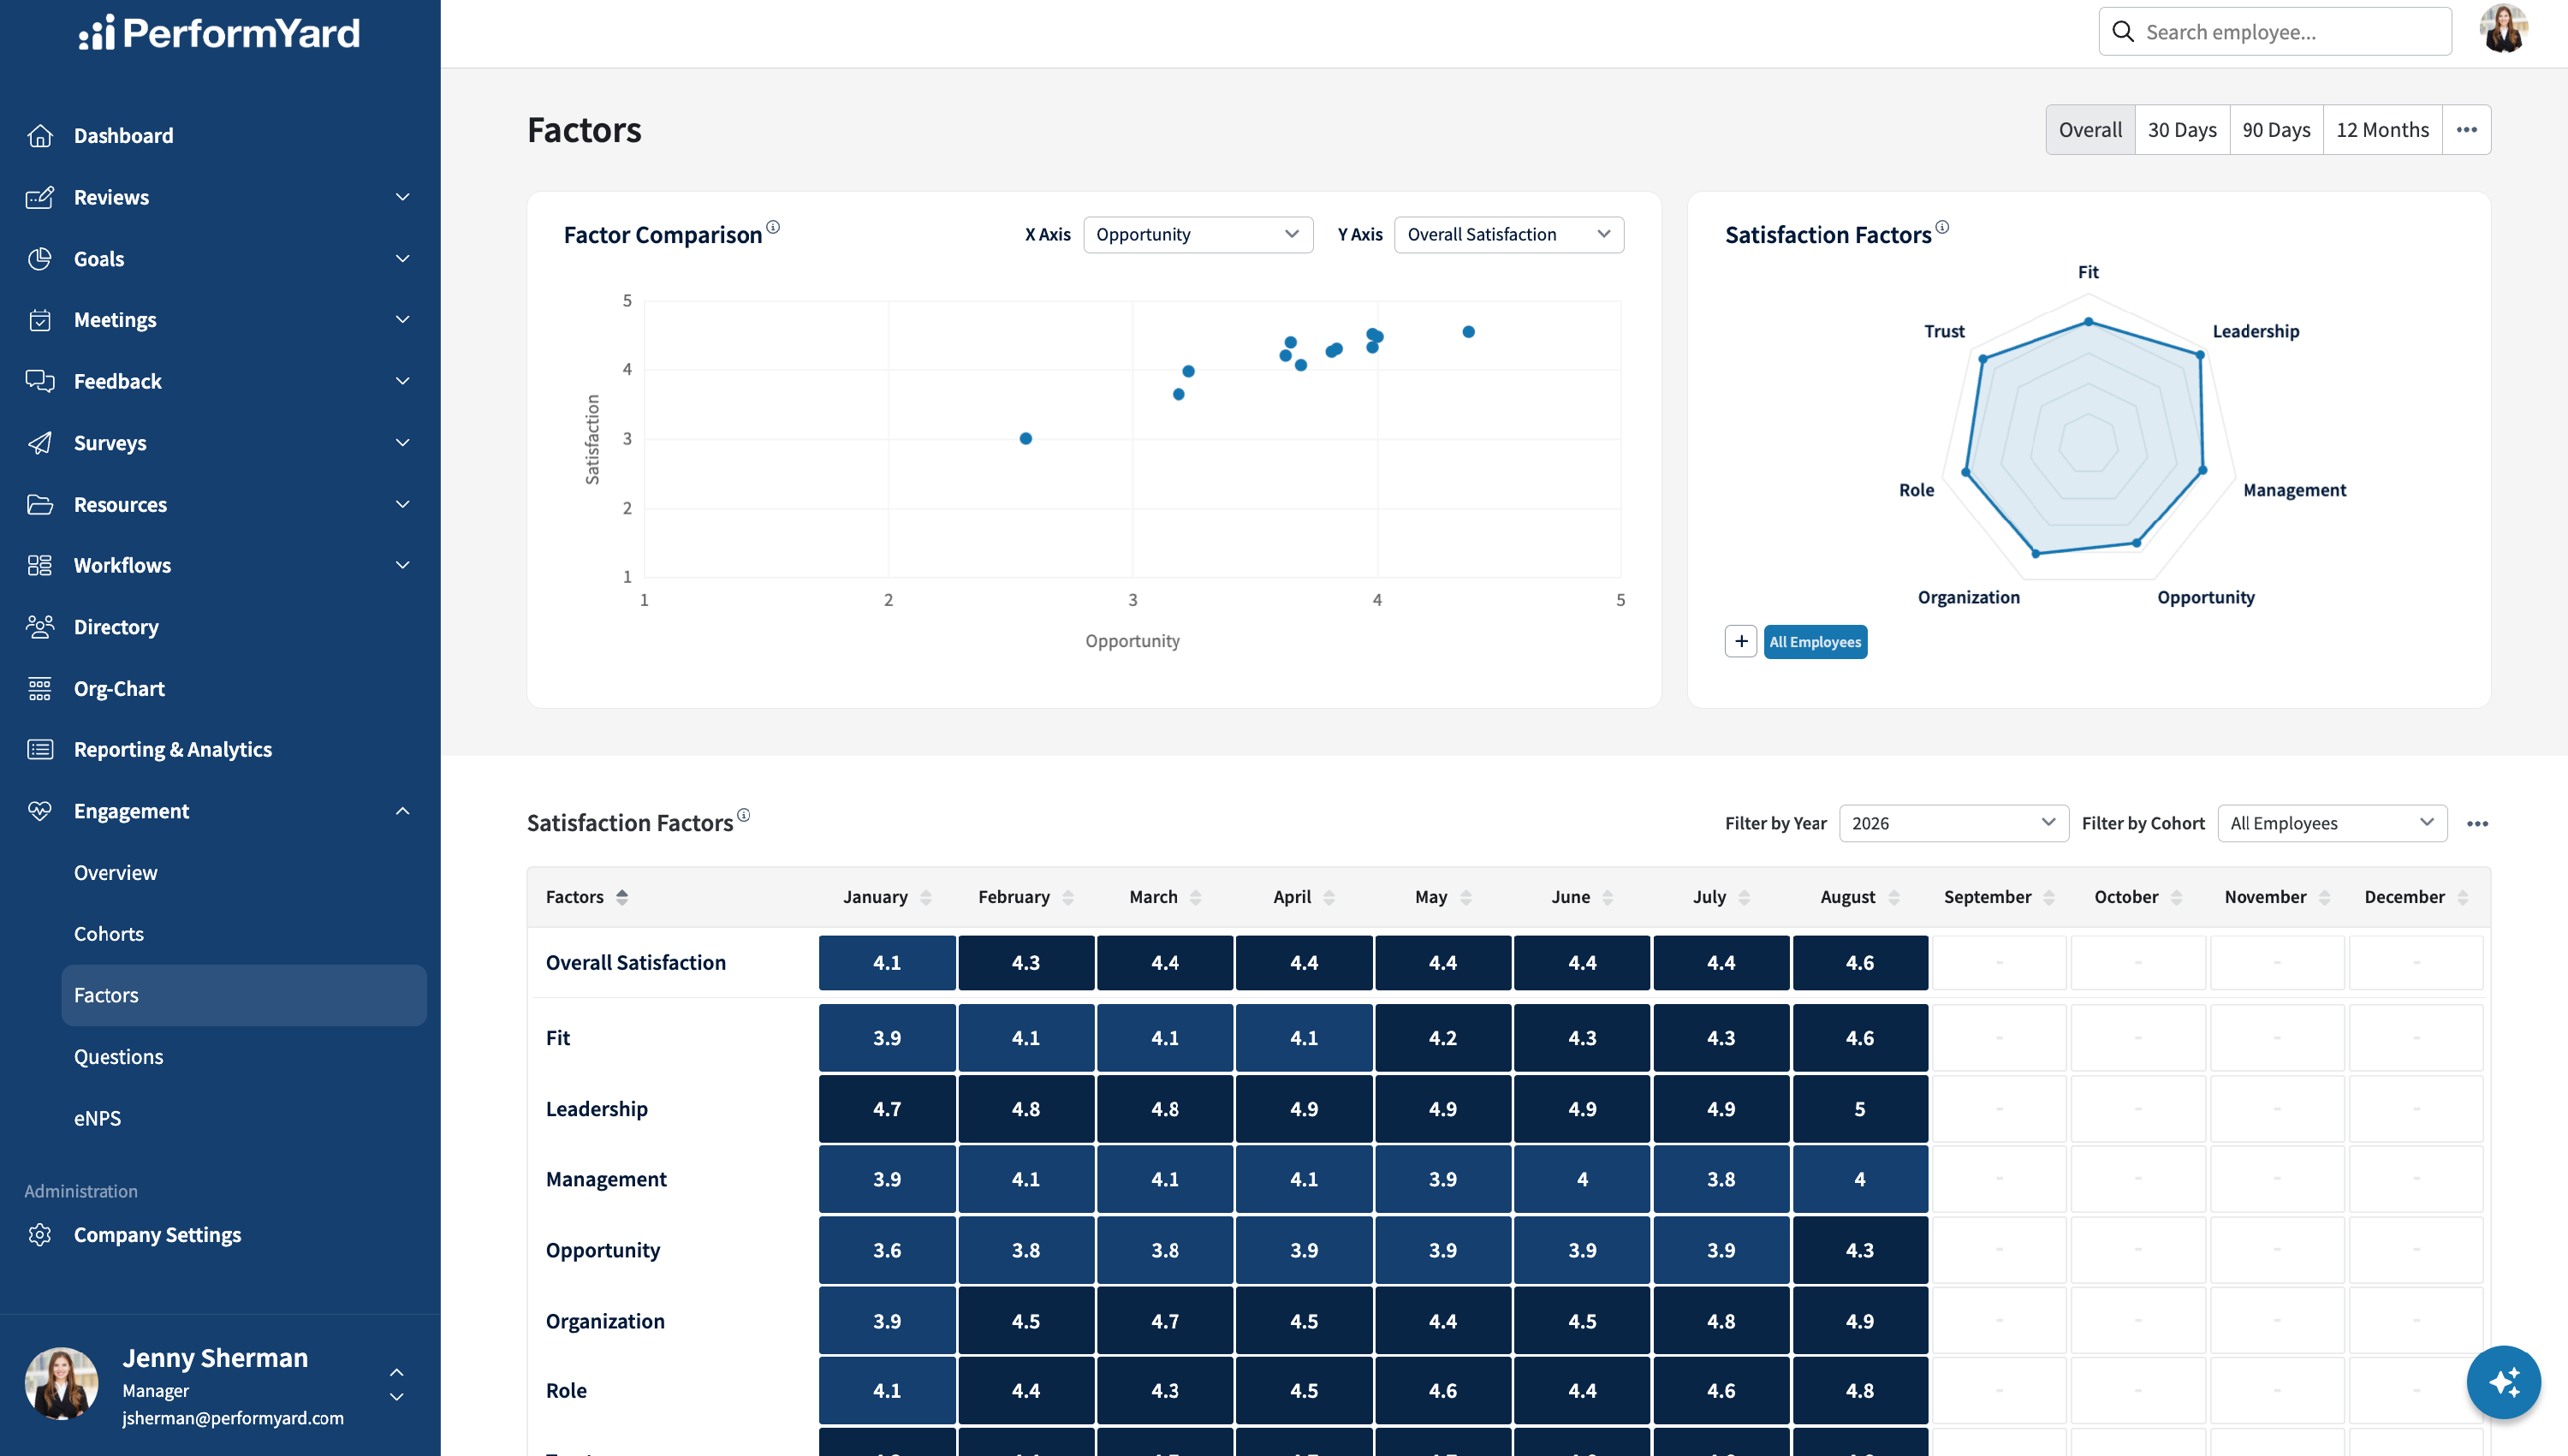
Factors Comparison Chart
Unlike most charts in the Engagement dashboard, the Factors comparison chart allows for visualizing individual (anonymous) employees and their ratings across two factors or comparing them to overall satisfaction. An HR Administrator can switch the factors for visualization and look for potential clusters of employees that may indicate some opportunities for improvement. In addition, when enabled, the employee's average rating (0..10) on the ENPS question is also visualized by coloring the employee's dot as red, yellow, or green for detractor, passive, or promoter. When no eNPS information is available for that employee, the color dot is blue.

Satisfaction Factors Radar Chart
The Factors radar chart will show the scores for the individual factors contributing to the overall satisfaction rating for the selected cohorts and period. You can hover your mouse over a point to get a specific value representing the average score across all surveys and answers during the specified time range. You can select up to three cohorts for comparison with the company-wide satisfaction factor ratings.

Satisfaction Factor Heatmap
The Factor Heatmap table allows for comparing factors over time with the ability to filter the data by calendar year and individual cohort. The column headers can initiate column sorting to more easily discover which factors were rated highest or lowest in a given month by employees or cohorts of employees.

Factors of Engagement & Satisfaction
The PerformYard Employee Engagement & Satisfaction module collects employee feedback across seven built-in factors through predefined questions. The module also supports the creation of up to 10 custom factors.
Engagement Factors
PerformYard includes seven standard factors. These cannot be modified or removed:
| Factor | Description |
| Role | Measures employees' satisfaction with their job, responsibilities, and organizational role. |
| Management | Measures employees' satisfaction with their direct managers and the direction they receive from their manager. |
| Leadership | Measures employees' satisfaction with the company or organization's leadership and vision. |
| Organization | Measures employees' satisfaction with their team, their company, and the company's direction. |
| Trust | Measures employees' satisfaction with the company's recognition of accomplishments, measurement of performance, and treatment of employees. |
| Fit | Measures employees' view of their fit within the company, sense of belonging, and alignment with company values. |
| Opportunity | Measures employees' satisfaction with opportunities for growth and advancement at the company. |
Custom Factors
In addition to the seven standard factors, HR administrators can create up to 10 custom factors to capture feedback specific to their organization. Custom factors are created and managed from Company Settings > Engagement Settings > Questions & Factors.
When creating a custom factor, you will provide:
- Name - a required field that must be unique and cannot match an existing factor name.
- Description - optional field to provide additional context about the factor
- Include in Satisfaction Metrics - when checked, the custom factor will contribute to your organization's overall satisfaction calculation.
Additional rules for custom factors:
- Up to 3 custom factors can be set to contribute to the Overall Satisfaction score at any time.
- Organizations are limited to 10 custom factors total.
- Only rating-scale custom questions assigned to the factor contribute to the satisfaction score. Custom text question types will not impact scoring.
- At least one enabled rating-scale question must be assigned to a custom factor before it will impact the Overall Satisfaction score.
After creating a custom factor, admins can modify its name, description, and Overall Satisfaction inclusion status. You can assign existing custom questions to custom factors or modify existing assignments as desired. Custom questions that have not been assigned to a custom factor will show "Unassigned" for its factor assignment.
Overall Satisfaction
An overall satisfaction score is calculated using the average across all available factors for a selected period. Each factor is weighed equally in calculating the overall score. By default, Overall Satisfaction is calculated from the seven standard engagement factors. HR administrators can also choose up to 3 custom factors to include in the Overall Satisfaction calculation.
The overall satisfaction is provided to offer a quick gauge of employee satisfaction. Still, HR Administrators are encouraged to look at the factors contributing to the overall score to get a fuller picture of the current state of employees' satisfaction and engagement. Visualizations in the HR Administrator dashboard, like the radar charts, provide visibility into the components - both standard and custom - that make up the overall score.